This blog references an opinion and is for entertainment and informational purposes only. It is not intended to be investment advice. Seek a duly licensed professional for investment advice.
In this 30th Market Outlook here at Ostium Research, we'll be taking a look at the week ahead in markets, focusing specifically on price-action, positioning and event risk for Bitcoin, Ethereum, Gold, DXY and SPX.
Firstly, let's take a look at the calendar, with a more inflation-heavy week ahead, alongside several speeches:
WEDNESDAY: RBNZ INTEREST RATE DECISION: (CONSENSUS 3.5% VS PREVIOUS 3.75%)
WEDNESDAY: BOJ GOVERNOR UEDA SPEECH
WEDNESDAY: FOMC MINUTES
THURSDAY: US CPI (YOY) (MAR): (CONSENSUS 2.6% VS PREVIOUS 2.8%)
THURSDAY: US INITIAL JOBLESS CLAIMS: (CONSENSUS 224K VS PREVIOUS 219K)
FRIDAY: ECB PRESIDENT LAGARDE SPEECH
FRIDAY: US PPI EX FOOD AND ENERGY (YOY) (MAR): (CONSENSUS 3.6% VS PREVIOUS 3.4%)
FRIDAY: US MICHIGAN CONSUMER SENTIMENT INDEX (APR): (CONSENSUS 54.7 VS PREVIOUS 57)
Now, let's dig into asset-specific price-action for the week ahead, looking firstly at Bitcoin:
Bitcoin:
Price:
Monthly:
If we begin by looking at the monthly for BTC, we can see that whilst March saw prices push below the February low, we bounced higher into the close to finish up Q1 at $82.5k. Since then, in early Q2 price-action, price has taken out the Q1 low into the March 2024 high turned support at $73.6k and bounced, currently trading back above $79k. Obviously, we are very early into April but a second consecutive failure to close below the prior monthly low into historical support would be decidedly bullish for the rest of Q2, which remains my base case here. When we look at the zoomed out price-action, there really is very little by way of difference between this most recent correction and the prior two major corrections within the larger uptrend. As long as we do not now close back inside the previous range resistance turned support (and prior cycle highs), this is quite literally a retest. Should April close below $73k, the structure begins to look much weaker - yes we do still have a higher-low above that August low within the monthly structure, but this would be the first time closing back inside a prior range throughout this run, which itself is confluent with a historical resistance level. In that scenario, I think we see extended consolidation within that prior $49k - $73k range before any emergence. My base case, however, remains, that we are here marking out a higher-low above prior resistance and Q2 will see price push higher to retest all-time highs.
Weekly:
Turning to the weekly, we can see that momentum has completely flattened out here after the correction, again resemblant of the prior two major ranges in this long-term uptrend. Last week saw price reject prior support turned resistance at $89k as expected and sell off, closing out the week back at $78.3k, before early price-action this week saw the sell-off continue to take out the $76.5k lows into $73.8k and bounce. This is still very early in a volatile week, but if we hold above $74k as resistance turned support, having taken out the prior two local lows (and on the back of escalating headlines between the US & China), that is very much the makings of a bottom. Weekly structure is still bearish and until we close the weekly above $89k, reclaiming that range support, this will remain the case. I see very little upside in being short-term bearish here, however, given the confluence of support below. If you want to take fresh shorts, a retest of $89k expecting it to hold would give you the tightest invalidation, whilst a close back below $74k would open up that next leg lower, most likely towards $68k, so await either of those two.
Daily:
Finally, turning to the daily, we have now retested the 360-day moving average at $76.2k, wicking below it into that March 2024 high and bouncing. Momentum is still very choppy here as you would expect and daily structure is bearish, but we do look like support is being reclaimed between $76.5k - $78.3k. Holding that range as support the rest of this week would be bullish into the rest of April, in my view, particularly given the lagged liquidity tailwinds and the possibility that - at least short-term - the market is shrugging off tariff escalation. Flip both the 360dMA and that March 2024 high into resistance and the picture does look more bleak, particularly given that that MA marked the lows in the previous range. In that scenario, you have $68k to take out the election low as the next level of interest, followed by $63.3k. As long as this confluence of support holds, any breakout beyond trendline resistance and back above the March open at $84.3k turns daily structure bullish and I would be very confident that $89k does not hold on another retest subsequent to that.
Now, looking at setups for the rest of the week, to be honest given how volatile things are it's a lot more fruitful to be reactive versus predictive here, and there's only really one setup I'm looking at (that you could play both long and short). Assume if $84.3k gets flipped it's game on for the bulls, but outside of that a dip into weekly open as a retest could be a nice long into mid-week to retest the April open at $82.5k:
And if that level then saw a breakdown in lower timeframe market structure, you could play the other side and fade it back into the weekly open post-Wednesday. I do think there's a better than expected chance that CPI comes in below consensus and that gives markets a pop, so watch out for headline risk around then:
And here's 3-month annualized basis, which is at Q4 2023 lows:
As well as a snapshot of positioning on Velo and CoinGlass:
And finally here are the 1-month and 1-week anticipated liquidation levels:
Ethereum:
Price: $1558
ETH/USD
Monthly:
Oh ETH - what a mess of a chart this is. Looking at the monthly, we saw March reject multi-year trendline support as resistance and close at monthly lows around $1800, through range support and back inside the capitulation candle from 2022. Early April trading has seen the March low give way and price push into the 2018 cycle high at $1420, as expected. It is kinda insane to think in inflation-adjusted dollars ETH is trading lower than January 2018. Nonetheless, we are now into historical support and I would not be looking for much further downside here despite how awful this looks. If we close the weekly below $1420, then we can talk about a return to bear market lows of $880, but I would not be shorting ETH into this support. More likely, I expect this area to begin marking out a local low from which we retest $2200 as major support turned resistance. On a longer-term outlook, there is no reason to be overweight ETH vs other assets yet.
Weekly:
Looking at the weekly, we can see momentum continues to tick down but price is right around the 360wMA that one would expect to provide some cushioning here, confluent with that historical resistance turned support. Early trading this week saw price tag that 2018 high and bounce and a close above $1600 this week would open up that short-term reversal back through $1747 into $2077 as the first target later this month. Weekly structure however remains bearish and we'll have to await a higher-low and higher-high formation before that changes. Below $1420, look out below.
Daily:
Dropping now into the daily, we can see momentum still looks awful but we did have a high-volume capitulation into support, which is good to see for short-term bullishness. Daily structure also remains bearish here and I'd be watching for a momentum breakout to follow alongside a close back above $1747 for a more sustainable reversal into that $2200 area. The problem with this chart is primarily how fucking high we need to bounce before even daily structure flips bullish and then you have massive overhead resistance beyond that. In short, I'm still not interested in ETH.
ETH/BTC
Monthly:
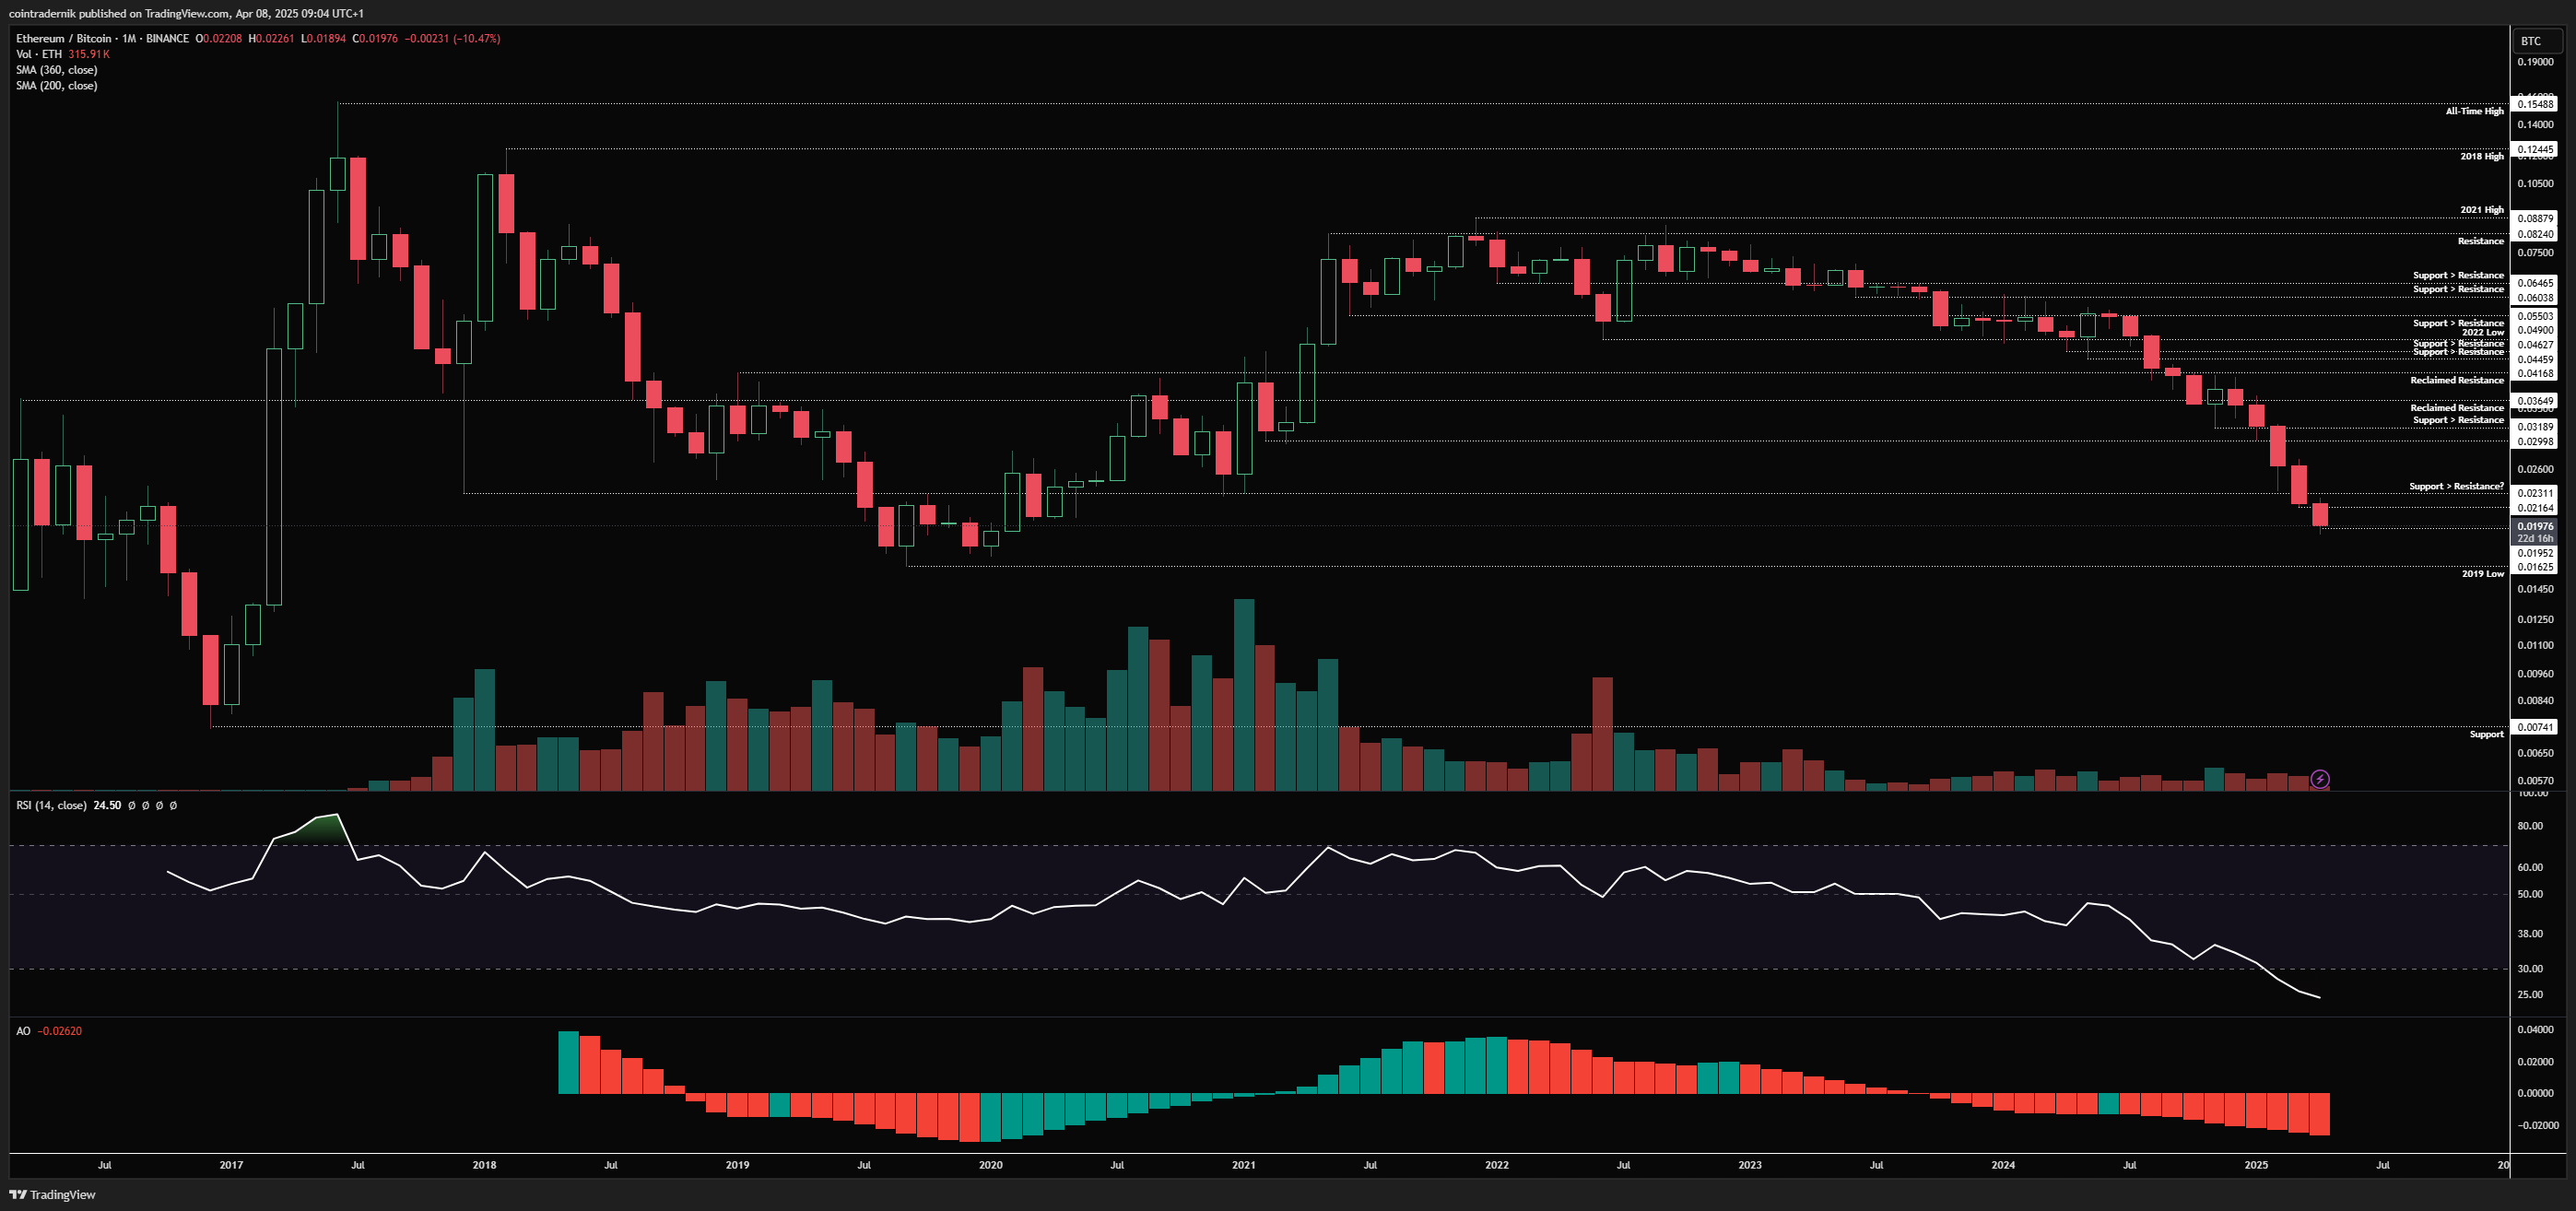
Looking at ETH/BTC on the monthly, we can see that March closed through historical support at 0.023, with price now in no man's land between that level and the 2019 low at 0.01625. As mentioned last week and above, there is zero reason to be overweight ETH at present until it gives us a clear reason to be. On this timeframe, there is no such signal and momentum and structure are firmly bearish with potentially 20% more downside into the next support. If April can close above 0.023, that might begin to look more constructive for the pair going into May and June.
Weekly:
Looking now at the weekly, RSI is the lowest it has been since that 2019 low, but this doesn't mean instant bottom - it means the momentum to the downside is as heavy as it has ever been. Thus, we need to see price validate a reversal. Again, on this timeframe it is currently nowhere to be found. Some sort of weekly hammer leading to a rebound and close back above 0.023 would look decent but ideally you want to see the formation of a higher-low and higher-high like that Q4 2019 period. Not much else to add for now...
Daily:
Finally, turning to the daily, I have marked out what I would want to see within this no man's land above the 2019 low to be even remotely interested in ETH. Basically, you want to see a lower-low in price below 0.019 lead to a divergence in momentum and then a reclaim of 0.019 as support. I would then expect to see continuation through trendline support, where flipping that as support becomes the much higher probability path for continued upside back through 0.023 and beyond. Alternatively, if we don't get the divergence or trend exhaustion formation, you'd need to see 0.023 flipped as support.
Subscribe to Ostium Labs
Receive the latest updates directly to your inbox
Your subscription could not be saved. Please try again.
Your subscription has been successful.
Gold:
Price: $3005
Monthly:
Beginning with the monthly for Gold, March (and Q1) finished strong indeed, pushing into all-time highs around $3167 and then closing at $3125. Momentum on this timeframe still looks solid for now but a break and close below 70 on monthly RSI would mark a lower-low and likely the end of this long-term uptrend, as in 2020 and 2011. Looking at price-action, you have higher-highs and lows and a firm uptrend, so any lower timeframe correction into $2800 should be seen as an opportunity to buy the dip with the view that the trend holds.
Weekly
Turning now to the weekly, we can see we've been running higher within this broader channel since 2024 and price is currently rejecting from channel resistance, with some early signs of momentum exhaustion. Nonetheless, we are currently retesting prior resistance as support at $2950 and should that level hold as a higher-low I would expect continuation through $3167 towards $3300 in Q2. If $2950 gives way, that sets up the deeper pull-back into $2800, where you could look to bid for another attempt at highs. A close below $2800 would begin to look more long-term bearish.
Daily:
On the daily timeframe, I have marked out these two trajectories, where the bullish scenario see this area hold as support and price flip $3056 as resistance turned support, leading to continuation higher and potentially some sort of consolidation pattern around $3170 that then leads to a blow-off top into $3300. There is a lot of confluence around that $3300 level for at least a mid-term top, so I'd be watching closely for signs of rejection and exhaustion up there should we get it. On the bearish trajectory, we see a lower-high form this week and price close below local trendline support, turning daily structure bearish and leading to a multi-week correction back towards the confluence of support around $2800.
Dollar Index:
Price: $102.75
Monthly:
On the monthly for the Dollar Index, we can see that price is firmly back inside the multi-year range after the fake-out in January, closing Q1 at 103.75. We have since traded into the 101 level I had marked out at the beginning of the year and bounced to trade back near 103, but I still expect any bounces in DXY to be short-lived. I now expect to see chop between 100-104 for the rest of Q2, with any higher timeframe close below 100 opening up a final leg lower, with 97 as the next support.
Weekly:
Looking at the weekly, we can see the accelerated price-action vs the 2017 Trump fractal, with price now consolidating around the 200wMA. I would expect to see 103.75 continue to act as resistance here in April but don't rule out a larger squeeze through that level. Ultimately though, the trend and momentum is to the downside and I don't expect the 200wMA to hold through Q2, with 100 likely to be tested over the coming weeks. A weekly close above 105.5 invalidated this outlook for continued dollar weakness.
Daily:
Turning finally to the daily, we can see that given the volatility of the past few days price-action and momentum have been choppy, but prior support continues to cap price as fresh resistance. We did get a good bounce off that 2024 open at 101 and if this bounce has legs I would expect the 200dMA, 360dMA and trendline resistance confluence around 104.3 to be retested but ultimately lead to another leg lower in May into the very bottom of the range at 100. Nothing else to add here.
SPX:
Price: $5130
Monthly:
Looking at the monthly for SPX, we can see that March closed below support at $5692 and the market has puked since then, flipping that level as resistance and breaking below multi-year trendline support from the Covid low, wicking through $5095 into the 2021 highs at $4800, currently acting as support. Price bounced off that level and is now trading back above $5095, but an April close below trendline support would not look pretty. If we can push back above that trendline into the monthly close, there's a strong case for the lows being in and price to rally back into all-time highs from there through the rest of Q2. Close April below $4800 and we have a big problem, with the next leg lower likely to take price at least towards $4130, which would be around a 33% drawdown from all-time highs, more consistent with recessionary bear markets. If the market does not expect a recession, we will not trade near those level, in my view. I won't get into a long analysis here of why, despite tariffs, I do not believe we're in recession territory, as this is a price-action-focused Outlook, but I will state that I think this remains simply a growth scare and a slowdown with volatility that has been augmented by the tariff narrative.
Weekly:
Looking at the weekly, we can see that price closed below that trendline support highlighted above and sold off right into prior resistance turned support at $4800, which had marked the 2021 highs. This is also marginally above the 200-week moving average at $4680, where I would expect significant demand to step in should we reject this bounce and form a lower-low into next week. Momentum is bearish, structure is bearish and until we reclaim the trendline you should be cautious about getting greedy with longs. If $5280 holds as resistance and price breaks down, we likely flush $4800 into the 200wMA. I mentioned on X yesterday that the market it currently shrugging off escalating headlines around tariffs, which is a promising sign for a meaningful bounce off that low, but until price reclaims that overhead resistance as support a bounce is all it is. Conversely, if we do get the 200wMA, I think that's a very good opportunity for longs and would likely mark the very bottom of this correction assuming we are not in a recessionary bear market. If I'm wrong and we are in the latter, we trade into that confluence of support at $4100.
Daily:
Finally, looking at the daily, we can see how violent the price-action has been in April, with the gap down below the 360dMA leading to that much sharper leg lower into $5100, before yesterday's move sent price further into $4800. We bounced off that level but obviously daily momentum and structure is still bearish. The market has shown its hand however in wanting any reason it can get for a meaningful bounce and I would expect continuation of that into $5300ish to retest trendline support as resistance over the next day or so. If we can close the daily back above that, that opens up a much larger squeeze, as those who sold into the bottom chase price higher, where the 360dMA retest and $5500 come into view...
I hope you've found some value in the read this week!
And if you've not already signed up for Ostium, please do so and test out some of the recent updates, including:
On-chain leverage for indices including NDX, SPX, FTSE & more...
Unified accounts and gas-free trading
Imminent listing of single-stock perpetuals, including TSLA, NVDA and META (but you didn't hear that from me...)


-2025-04-08_08_37_16.png)
-2025-04-08_08_38_51.png)