This blog references an opinion and is for entertainment and informational purposes only. It is not intended to be investment advice. Seek a duly licensed professional for investment advice.
In this 27th Market Outlook here at Ostium Research, we'll be taking a look at the week ahead in markets, focusing specifically on price-action, positioning and event risk for Bitcoin, Ethereum, Gold, DXY and altcoins via OTHERS.
Firstly, let's take a look at the calendar, with a very busy week ahead:
MONDAY: US RETAIL SALES (MOM) (FEB): (CONSENSUS 0.7% VS PREVIOUS -0.9%)
TUESDAY: US INDUSTRIAL PRODUCTION (MOM) (FEB): (CONSENSUS 0.2% VS PREVIOUS 0.5%)
WEDNESDAY: BANK OF JAPAN INTEREST RATE DECISION: (CONSENSUS 0.5% VS PREVIOUS 0.5%)
WEDNESDAY: FED INTEREST RATE DECISION: (CONSENSUS 4.5% VS PREVIOUS 4.5%)
WEDNESDAY: FOMC PRESS CONFERENCE
THURSDAY: ECB PRESIDENT LAGARDE SPEECH
THURSDAY: SNB INTEREST RATE DECISION: (CONSENSUS 0.25% VS PREVIOUS 0.5%)
THURSDAY: BANK OF ENGLAND INTEREST RATE DECISION: (CONSENSUS 4.5% VS PREVIOUS 4.5%)
THURSDAY: US INITIAL JOBLESS CLAIMS: (CONSENSUS 224K VS PREVIOUS 220K)
Now, let's dig into asset-specific price-action for the week ahead, looking firstly at Bitcoin:
Bitcoin:
Price: $83,416
Weekly:
If we begin by looking at BTC/USD on the weekly, we can see that last week saw price wick below the $78k lows into $76k before bouncing above trendline support to close the week green, comfortably above this cluster of resistance turned support above prior all-time highs. This is a promising start to the bottoming out process, but we remain just chopping around within the range of the capitulation candle. As long as $78k holds as support this week, however, I think it is likely we see $89k retested from below as support turned resistance, likely next week. Conversely, if we close the weekly below $78k, we begin what I expect to be the final leg lower, likely pushing into $74k but potentially wicking as low as $69k. Ultimately, my expectation remains that BTC bottoms out here in late March going into April and we begin to meaningfully reverse this correction in Q2. Not much else to add on this timeframe for now...
Daily:
Looking at the daily, we can see that price closed below the 200dMA, breaking below the March open at $84.3k. This led to that push through $78k as anticipated last week, with price holding marginally above the 360dMA to form the low at $76.7k before bouncing back into the March open and 200dMA resistance cluster, around which it is consolidating. Momentum is diverging here on the downside but I would like to see that trendline on daily RSI broken with a higher-high in momentum accompanying any move above the March open to be more confident in $76.7k as a strong contender for the bottom here. If we do flip the March open and push into trendline resistance from all-time highs alongside an underside retest of $89k, I think any subsequent low marks out a higher-low above $76.7k. If, however, we wick above last week's highs and reject, then pushing back below trendline support, we likely see $73.8k tagged shortly after, where I expect a lot of buyers to step in. The bottom of the Trump candle is right at 2021 cycle highs ~$69k, so that would be the lowest I expect price to push into in this correction. Flipping $69k back into resistance would be a clear signal that something major has changed within this longer-term bull market.
So, looking at some intraweek setups, I have a couple of longs that make sense and a short that would be higher probability...
For the first long, a wick below $82k followed by a reclaim of the weekly open as support could be the shallow pull-back that leads to the breakout beyond $85k here, but I would look to take partial profits on this setup at $85.7k followed by $89k:
A more favourable long setup would be for price to continue pushing lower early this week, breaking comfortably below the weekly open, holding below it and then spiking below $80k into support and sharply reversing, where you could look to add back above $80k and then more aggressively on a reclaim of weekly open, again looking for $85.7k, but more likely going as far as that $90k resistance cluster:
I think this short idea would be pretty poor R/R depending on how it sets up this week but if we hold above the weekly open going into mid-week, wick above $85.7k and then reject hard, flipping the March open back into resistance, that would be a nice entry for at least a run of the $82k level into $80k:
And here's 3-month annualized basis:
As well as a snapshot of positioning on Velo and CoinGlass:
And finally here are the 1-month and 1-week anticipated liquidation levels:
Ethereum:
Price: $1899
ETH/USD
Weekly:
Looking at ETH/USD on the weekly timeframe, we can see that price did reject at prior support turned resistance at $2158 and push lower immediately into the $1770 level I highlighted last week, and we are now firmly in no man's land for ETH: that is to say, despite how shit it looks there is now poor R/R for shorts but also no signs of demand for longs. We have the 360wMA below at $1590 and then 2018 highs at $1420 as the next major levels, where any push into that latter level would probably be a blind bid kind of deal given its historical significance. But unless we get that I would not be looking for ETH longs until we reclaim the multi-year range support at $2158. One small thing in the favour of ETH bulls here is the declining volume on the move from the 200wMA through range support into $1770 over the past few weeks. If we get a high volume reclaim of $2158, then you've got a more meaningful signal for a reversal.
Daily:
Looking at the daily, daily momentum remains bearish, daily structure remains bearish and all the rallies continue to be capped by that downtrend on RSI from November. The highest probability bottoming pattern here would be another push below $1770 that actually forms some trend exhaustion, then follow-through from that divergence with daily structure turning bullish (higher-high -> higher-low above $1770) accompanied by a breakout above the trendline in daily RSI. If we see something roughly like that, I'll stop thinking this looks pathetic. For now, I'm not touching it...
ETH/BTC
Weekly:
Looking at the weekly for ETH/BTC, we finally filled in the whole wick to close the week marginally below 0.023, with momentum continuing to point to downside and no sign of strength from bulls even at this historical level. As I mentioned last week, this is truly the last meaningful level of demand on the chart before the2019 low at 0.0163, so if we don't see bulls step in over the next week or two and 0.023 turns into resistance, that's where we're headed. Nothing more to add for the time being...
Daily:
On the daily, we can see how daily support keeps being flipped as resistance as price breaks lower filling in the entire capitulation wick, with no signs of trend exhaustion as of yet. We are now consolidating for several days right around 0.023 but again there is nothing currently to suggest buyers are willing to step in here. If we see a meaningful push below this level met with an immediate reclaim of 0.023 as support, that starts to look more interesting, but really I would like to see daily structure flip bullish alongside momentum before looking for any ETH exposure.
Subscribe to Ostium Labs
Receive the latest updates directly to your inbox
Your subscription could not be saved. Please try again.
Your subscription has been successful.
Gold:
Price: $2985
Weekly:
Looking at the weekly for Gold, the potential local top formation was invalidated - as is often the case in strong bull trends - by the weekly close through prior highs at $2960, with Gold pushing above $3000 and closing the week out at $2988. Whilst it is possible that you get some sort of weekly divergence now forming, until we see evidence of that (i.e. a weekly close back below $2960ish this week followed by a push lower the subsequent week), it is more probable that the weakness has been invalidated and we are moving higher from here. Now, if price can hold $2960 as resistance turned support this week, I think we see Gold extend into $3045 as the next minor resistance with $3300 as the next major resistance to tag over the coming months.
Daily:
Turning to the daily, we can see that we had momentum exhaustion and a subsequent breakdown that led to the move into $2834 and since then price has turned daily structure bullish, accompanied by higher-highs and lows on momentum invalidating the likelihood of continuation lower. We have see this higher-high in momentum form as price broke and closed through prior all-time highs, which is a good indication as to this not being a bull trap. For bears, you really need to see weakness this week, with an immediate rejection of this push through $3000 leading to a close below $2946 on the daily and subsequently a lower-low below $2877, turning structure bearish once more after deviating all-time highs - now that would be a solid short setup for a multi-week correction. Until we see that through, it is likely any move lower this week forms a higher-low from which Gold pushes into $3045. Again, there is a lot of confluence around $3300 for the next major resistance should we flip $3000 as support here.
Dollar Index:
Price: $103.31
Weekly:
Looking at the Dollar Index, on the weekly timeframe we can see just how strong that move back inside the multi-year range was, with the Dollar not even catching a small bid last week around 103.8 historical resistance. Instead, we are now consolidating below that level but above the mid-range at 102.88. I do still think we see some sort of bounce around this mid-range to retest the 105.5 area as reclaimed resistance going into Q2, but ultimately I expect we see continuation of this move lower back towards the bottom of the range at 100-101 later in H1. A weekly close back above 105.5 could change this outlook.
Daily:
Looking now at the daily, we can see how something like this might play out if we see trend exhaustion into 103 met with a bounce back above 103.7, leading to a retest of trendline resistance from the 2025 high and the top of the range. I think that would be a good area to look for further downside in DXY with the 2024 open at 101 the next major level of support below. As long as 105.5 isn't flipped as support, I think this trajectory holds true and ultimately provides tailwinds to risk further down the line.
Others:
Price: $228.64bn
OTHERS/USD
Weekly:
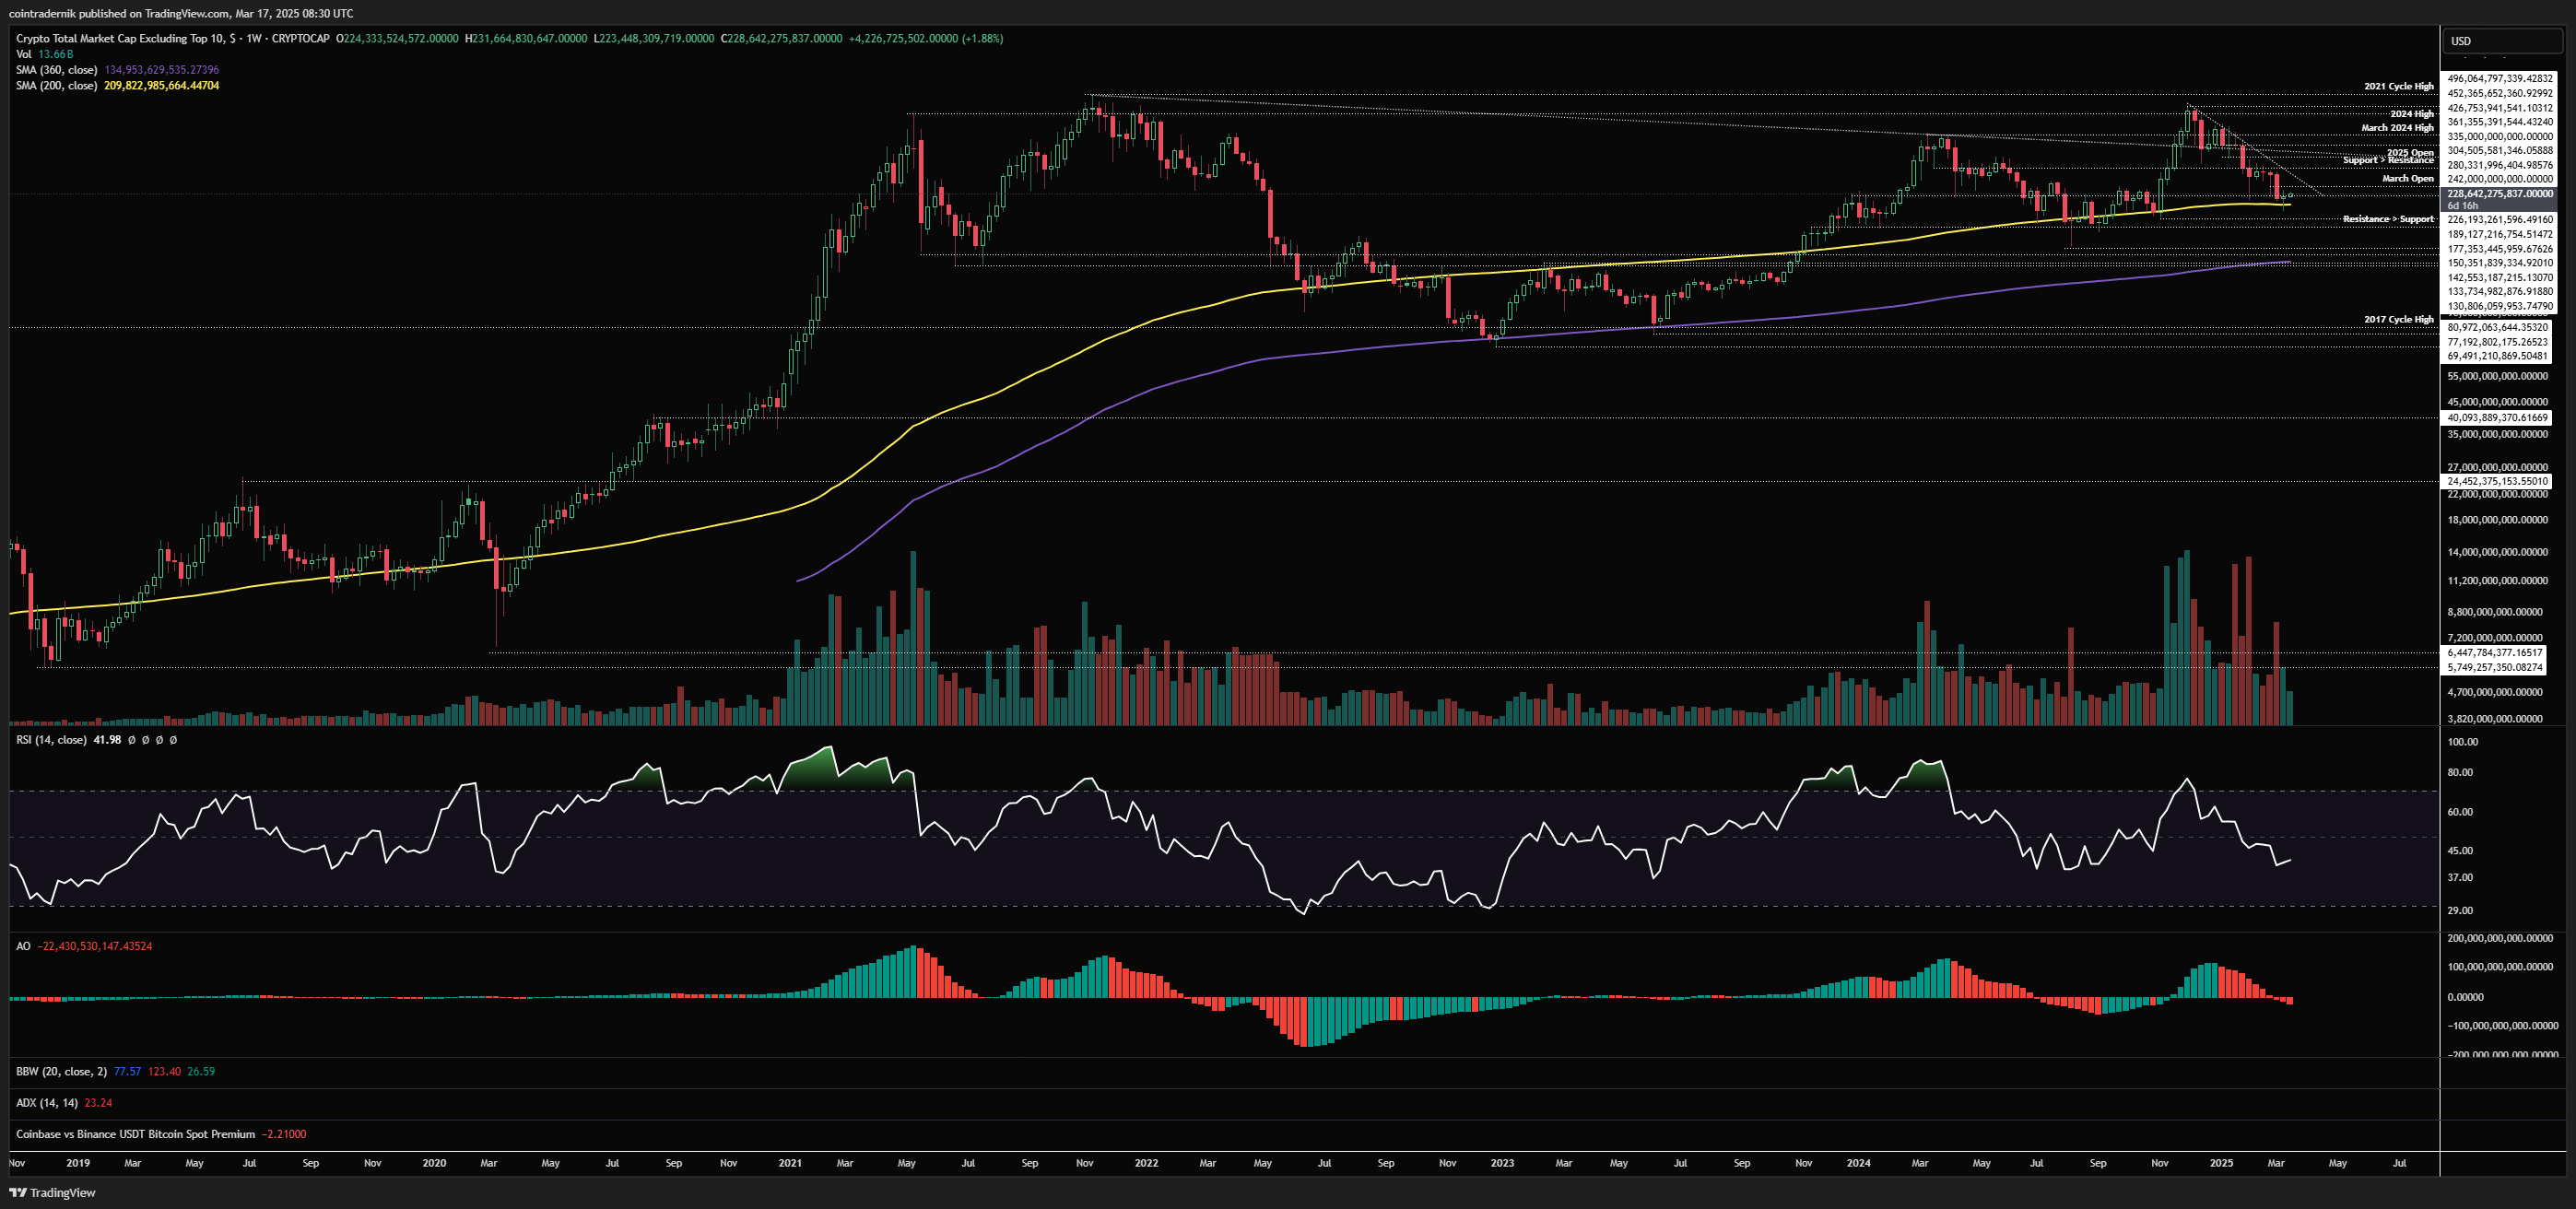
If we begin by looking at OTHERS on the weekly, we can see that altcoins are finding support right around the 200wMA that marked out the pre-Trump lows and the summer consolidation in 2024. We remain capped by trendline resistance from the 2024 highs but last week saw alts bounce nicely after wicking below the 200wMA to print a bit of a reversal hammer. Now, I fully expect alts to bottom first, but whether the bottom is in yet I am unsure, as I could definitely see a bounce into March open at $242bn met with a final leg lower before we see some trend exhaustion. We are seeing lower volume traded as we push lower, providing some confluence for seller exhaustion into this multi-year support area for OTHERS. If we flip the 200wMA as resistance and then break below the $190bn level, I would then expect another more severe leg lower to follow in true bear market style that takes OTHERS towards the 360wMA which marked the bottom in 2022 and 2023, which is currently around $135bn. My expectation for this scenario is currently ~10%. Much more likely is we either have marked out the bottom or we get one leg lower into $190bn that marks the low, from which point we make higher-lows and then break beyond trendline resistance for continuation of another leg higher. A weekly close above the trendline on good volume will be a key signal.
Daily:
Looking at the daily, we can see that the bearish trajectory I marked out a few weeks ago has bee playing out as anticipated following $280bn turning resistance and we are now seeing momentum exhaustion into the lows on this timeframe, which is positive. If we do get that next leg lower and further trend exhaustion, that would be a very good opportunity to add exposure, in my opinion, if you are of the belief that there is still upside in this bull market (like I am). Risk/reward is increasingly favourable here as we come into Q2, in my opinion. For those more risk-averse, await a trendline breakout and subsequent higher-low above the March open.
Now, below we can see the US financial conditions proxy I use that has been somewhat unbelievably tightly mapping price-action since Q4 2023. There is a slight discrepancy in fit whether you look at this with an 11-week or a 15-week lag, but in either scenario there does appear to be a ~3 month lead time on domestic financial conditions vs price-action in crypto particularly since 2024. Each cycle and macro regime has its nuances, so there is zero chance this continues to map so tightly for years to come, but right now this is suggestive of Q2 tailwinds for risk driven by Dollar weakness in Q1, in precisely the inverse manner to the headwinds of this past quarter driven by Dollar strength in Q4 last year...
11-week and 15-week M2SL/DXY correlations:
OTHERS/BTC
Weekly:
Looking at the weekly, we continue to see long-term momentum divergence on OTHERS/BTC as alts consolidate around cyclical lows vs BTC. The lack of follow-through on the push below multi-year support is currently providing confluence to my view that Q2 should be favourable for alts and we see this momentum divergence validated by upside, but right now we do just remain in consolidation. If we close the weekly above ~3mn BTC are reclaim that range support, it's pretty clear where we're headed next in my view (back to the top of the range at ~4.4mn BTC); if over the coming weeks this consolidation gives way and we flip local lows as resistance, making fresh lows, then I am likely wrong and there is no real support below that all the way back to ~1.4mn BTC, which is a 50% haircut on alts vs BTC from here and not something I would be even remotely interested in holding through.
Daily:
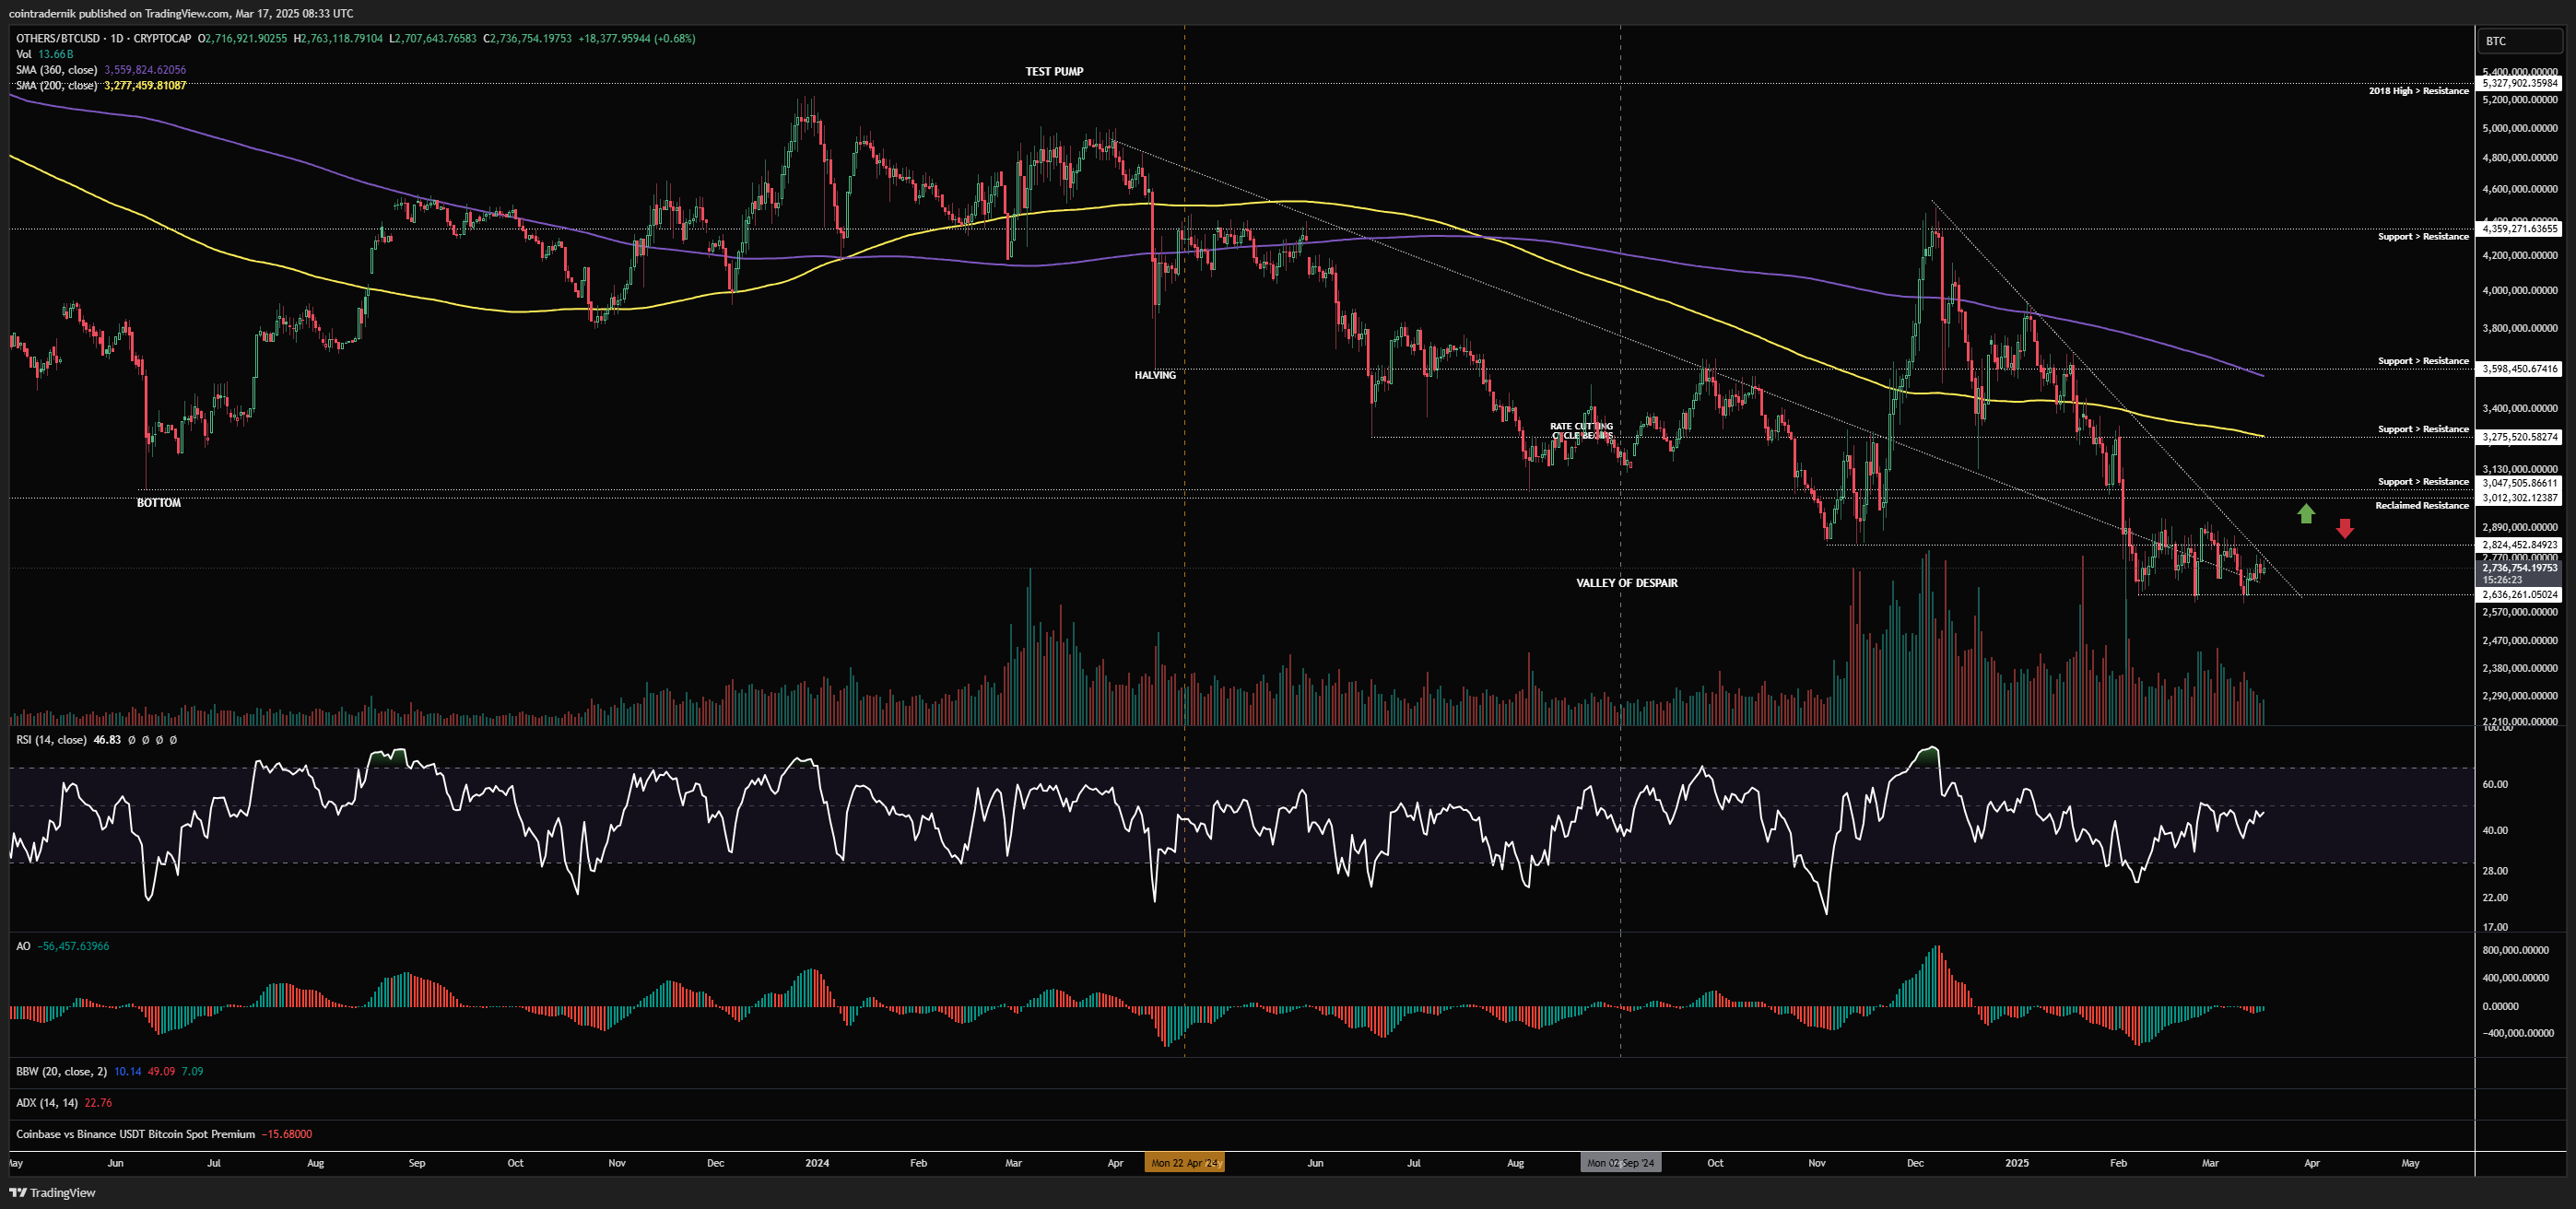
Finally, looking at the daily, we can see momentum exhaustion into the lows on this timeframe too, but alts continue to be tightly rangebound between 2.6mn BTC and 2.9mn BTC. If we can decisively break trendline resistance here and reclaim ~3mn BTC as support, that would be really good confluence for a period of outperformance beginning for alts, as non-consensus as that now is. If, however, we deviate the top of this range and then break below 2.6mn BTC, invalidating much of this trend exhaustion, I would be cutting all recent alt positioning and awaiting a clearer signal.
I hope you've found some value in the read this week!
Oh, and if you've not tried out trading Real-World Assets on Ostium yet, you can now do soherewith the launch of their public mainnet.